

Core Web Vitals Optimization Service: 7 Proven Steps (2026)

Key Takeaways & Performance Summary
- LCP Under 2.0s: Real-world Largest Contentful Paint requires sub-200ms TTFB, critical path CSS inlining, and preloading hero assets with
fetchpriority="high". - CLS to Absolute Zero: Cumulative Layout Shift is eliminated by declaring explicit HTML dimensions, CSS
aspect-ratio: 16 / 9, and switching typography tofont-display: optional. - INP Sub-200ms Responsiveness: Interaction to Next Paint issues stem from main-thread JavaScript blocking; resolved by breaking long tasks past 50ms and offloading scripts to Web Workers.
- CrUX Real-User Telemetry: Google evaluates search rankings on 28-day rolling 75th percentile (P75) field data across mobile users, rendering synthetic lab tests insufficient on their own.
Core Web Vitals optimization service engineering resolves Google search ranking devaluations by eliminating Largest Contentful Paint (LCP) delays, Cumulative Layout Shift (CLS) reflows, and Interaction to Next Paint (INP) latency. Yantra Media deploys server edge caching, critical path asset preloading, and main-thread JavaScript pruning to achieve sustained sub-2.0s load speeds.
According to the HTTP Archive 2024 Web Almanac Performance Report, 42.8% of mobile websites fail Core Web Vitals thresholds due to render-blocking scripts and unoptimized media assets. Yantra Media eliminates these technical bottlenecks across enterprise web properties, establishing stable architectures that protect search visibility and lift organic transaction rates.
This technical audit guide details exact engineering protocols to diagnose P75 CrUX field telemetry, configure sub-200ms TTFB edge caching, eliminate layout shifts, and enforce CI/CD performance guardrails across high-traffic digital platforms.
The Core Web Vitals Metrics: LCP, CLS, and INP Explained
Google’s Page Experience ranking signals center on three distinct user-centric performance metrics known as Core Web Vitals. These metrics assess how actual site visitors perceive the speed, responsiveness, and visual stability of a webpage.
Semantic Metric Definitions (AI & GEO Ready)
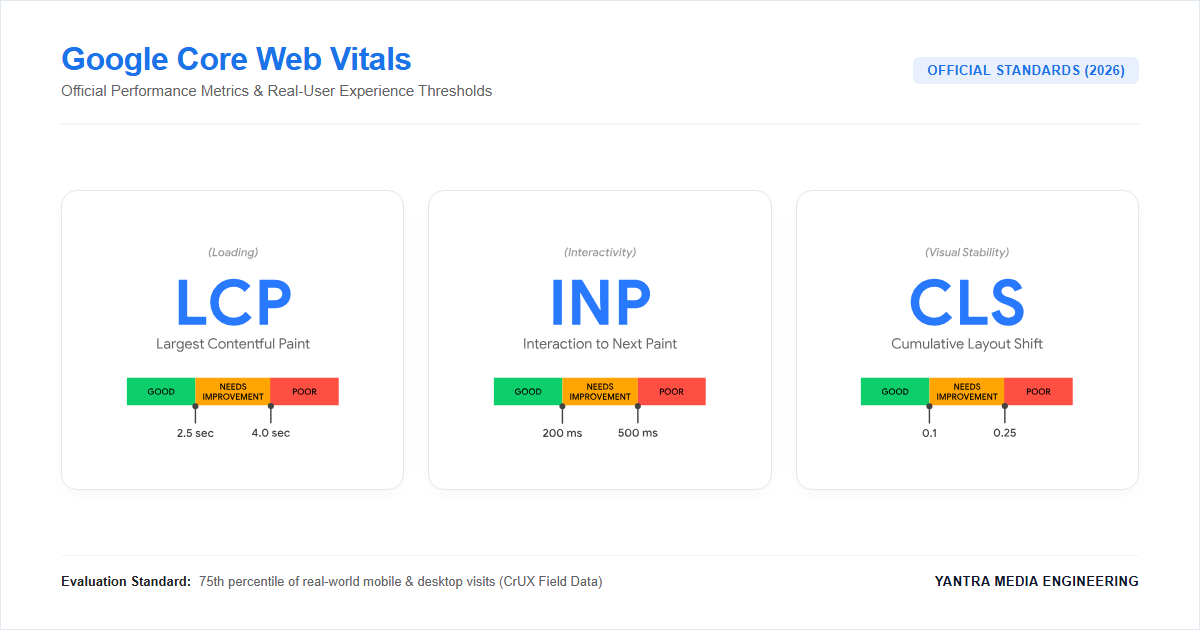
- Largest Contentful Paint (LCP): Measures perceived loading speed by marking the exact timestamp when the largest visual content element (hero image, video poster, or major text block) becomes visible in the viewport. Threshold: Sub-2.5 seconds (Good), sub-2.0 seconds (Yantra Media Enterprise Standard).
- Cumulative Layout Shift (CLS): Measures visual stability by calculating the aggregate score of all unexpected layout shifts occurring during the complete lifespan of the page. Threshold: Under 0.10 (Good), 0.00 (Yantra Media Zero-Shift Target).
- Interaction to Next Paint (INP): Replaced First Input Delay (FID) as an official Core Web Vital in March 2024. INP assesses overall page responsiveness by measuring the longest latency observed across all clicks, taps, and keyboard inputs throughout a user visit. Threshold: Sub-200 milliseconds (Good).
Core Web Vitals Performance Standards Matrix
The following performance benchmark table outlines Google’s official grading tiers alongside Yantra Media’s enterprise delivery benchmarks:
| Metric | Dimension | Google Good | Needs Improvement | Poor | Yantra Media Target |
|---|---|---|---|---|---|
| LCP | Loading Speed | ≤ 2.5s | 2.5s – 4.0s | > 4.0s | ≤ 1.8s |
| CLS | Visual Stability | ≤ 0.10 | 0.10 – 0.25 | > 0.25 | 0.00 |
| INP | Responsiveness | ≤ 200ms | 200ms – 500ms | > 500ms | ≤ 120ms |
Diagnosing Largest Contentful Paint (LCP) Delays: The 4-Phase Breakdown
To eliminate LCP bottlenecks, engineers must decompose the metric into its 4 constituent sub-parts as formalized by the W3C Navigation Timing API. Measuring each phase isolates whether delays originate at the host server, network transit layer, or browser rendering engine.
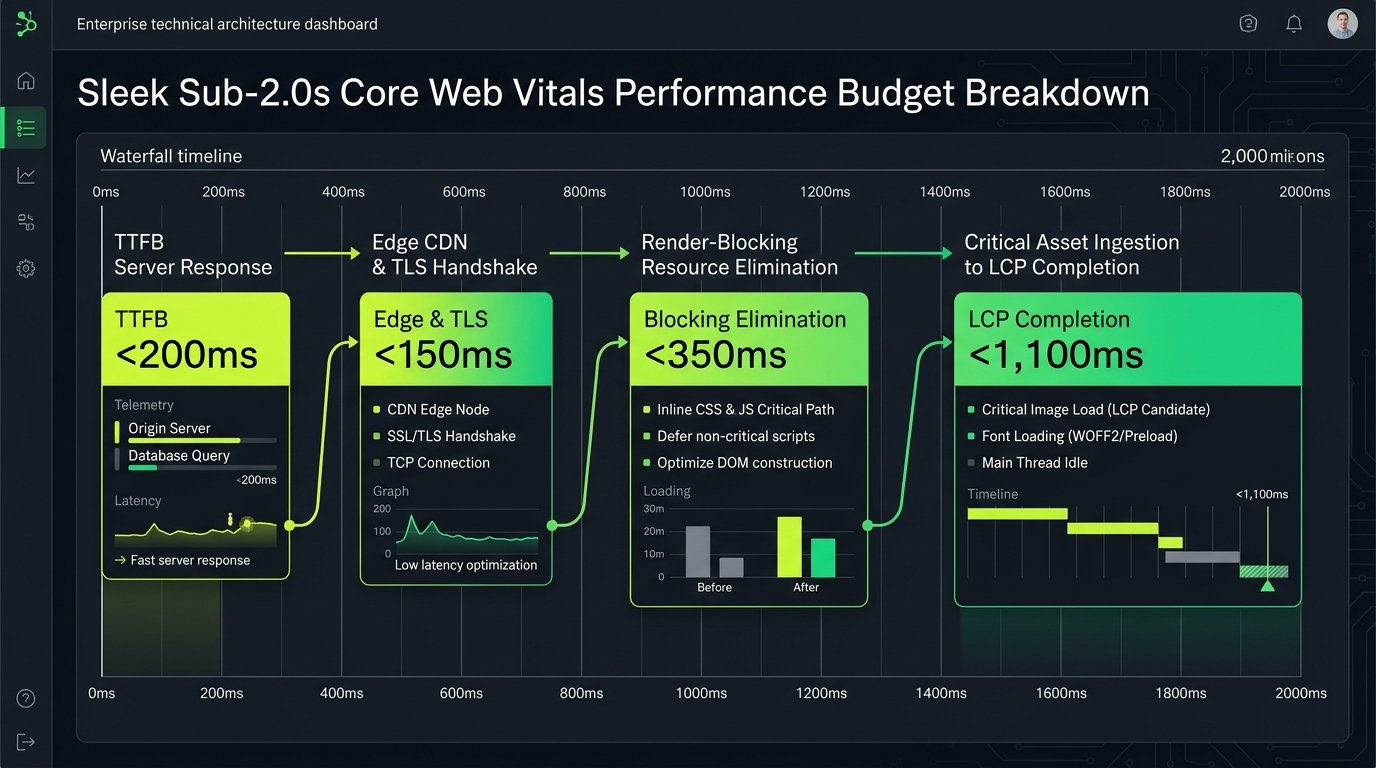
Phase 1: Time to First Byte (TTFB Target: ≤ 200ms)
TTFB represents the elapsed time between the client initiating the HTTP request and receiving the first byte of response data from the origin server. A slow TTFB inevitably delays every downstream rendering stage.
Phase 2: Resource Load Delay (Target: ≤ 150ms)
The time interval between TTFB completion and the moment the browser initiates fetching the LCP candidate asset. Common culprits include hiding hero images inside external CSS files, loading hero images via JavaScript frameworks, or placing the <img> tag deep down in the DOM markup.
Phase 3: Resource Load Time (Target: ≤ 500ms)
The total duration required for the browser to download the complete LCP asset payload across the network. Oversized PNG files, uncompressed JPEG assets, and missing Content Delivery Network (CDN) edge distribution inflate load times drastically.
Phase 4: Element Render Delay (Target: ≤ 100ms)
The time elapsed between the LCP asset finishing its download and the browser compositor actually painting the pixels onto the display. Heavy client-side JavaScript execution blocking the main thread or unoptimized CSSOM trees are the primary causes.
Eliminating Cumulative Layout Shift (CLS) to Zero
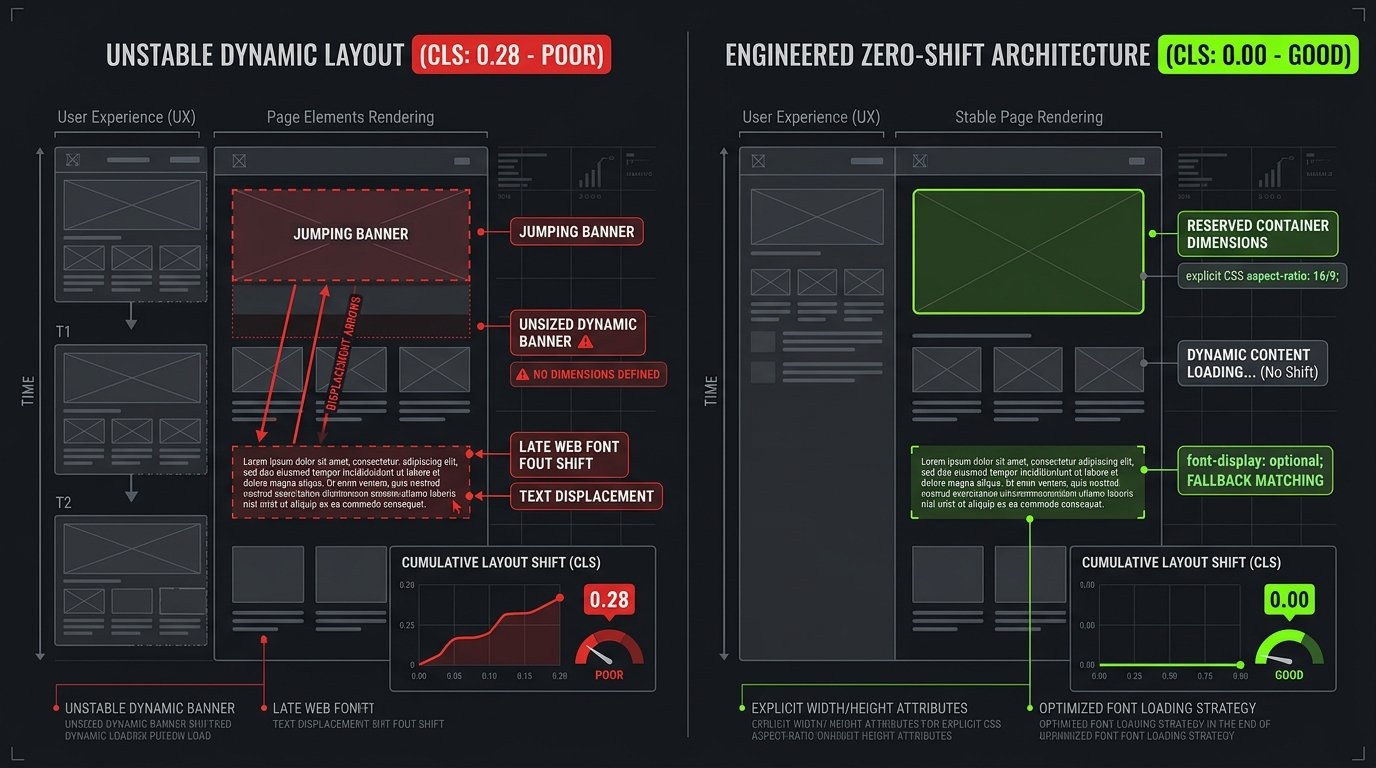
Layout shifts occur when visible elements change their starting coordinates between render frames, forcing surrounding content to jump unexpectedly. Google calculates CLS as the product of the impact fraction and the distance fraction.
1. Images and Embeds Without Explicit Dimensions
When browsers parse image tags lacking explicit width and height attributes, zero initial vertical space is allocated in the DOM layout. When the image asset finally downloads, the browser reflows the entire page geometry, pushing text blocks downward.
2. Web Font Layout Reflow (FOIT vs FOUT)
Flash of Invisible Text (FOIT) and Flash of Unstyled Text (FOUT) cause significant layout shifts. When fallback system fonts possess different x-heights and glyph widths than custom web fonts, swapping the font face alters paragraph heights across the viewport.
Optimizing Interaction to Next Paint (INP) and JavaScript Hygiene
Interaction to Next Paint (INP) tracks the latency of user interactions from input initiation until the browser paints the next visual frame. If the main execution thread is blocked parsing or executing lengthy JavaScript tasks, user clicks feel unresponsive.
Tasks exceeding 50 milliseconds are classified by Chromium as Long Tasks. When multiple long tasks stack within the browser event loop, user interactions stall, leading to failed Core Web Vitals audits.
7 Actionable Steps for Core Web Vitals Optimization Service
At Yantra Media, our technical performance team executes a structured 7-step engineering sprint to accelerate enterprise websites past Google’s performance thresholds. Each step tackles a specific layer of the network, server, and browser rendering stack:
1. CrUX Field Telemetry Audit vs Synthetic Lab Diagnostics (P75 Real-User Metrics)
Google ranks websites using real-world user metrics collected in the Chrome User Experience Report (CrUX) over a rolling 28-day window, evaluating the 75th percentile (P75) of mobile experiences rather than isolated synthetic lab tests.
- Origin-Level Metric Extraction: Query Google BigQuery CrUX datasets to isolate device-specific latencies and connection distributions across mobile users.
- Lab vs Field Variance Analysis: Reconcile differences between local DevTools throttling and real-world network fluctuations where device hardware throttling degrades JavaScript parsing speeds.
- Research Benchmark Citation: According to the HTTP Archive 2024 Web Almanac Performance Report, 42.8% of mobile origins fail the LCP threshold in real field conditions due to device hardware constraints.
- Continuous Field Tracking: Implement Real User Monitoring (RUM) beacons through our enterprise technical seo services to catch field performance regressions before Google refreshes rolling 28-day ranking scores.
SELECT
  form_factor.name AS device,
  ROUND(p75_lcp, 2) AS p75_lcp_seconds,
  ROUND(p75_cls, 3) AS p75_cls_score,
  ROUND(p75_inp, 0) AS p75_inp_ms
FROM
  `chrome-ux-report.materialized.metrics_summary`
WHERE
  origin = 'https://yourdomain.com'
  AND yyyymm = 202610
ORDER BY device;
2. Sub-200ms TTFB Server, Redis Caching & Edge Network Optimization
Time to First Byte establishes the foundation for all Core Web Vitals metrics. Origin servers that spend hundreds of milliseconds running database queries and executing server logic guarantee delayed Largest Contentful Paint timings.
- Persistent Object Caching: Implement Redis in-memory storage to cache database query results and reduce MySQL execution time to single-digit milliseconds.
- FastCGI Edge Microcaching: Deploy Nginx FastCGI microcaching to deliver pre-rendered static HTML responses directly to concurrent visitors without executing PHP runtime processes.
- Edge Network Acceleration: Route user requests through Cloudflare Tiered Cache with HTTP/3 QUIC protocol and Early Hints (HTTP 103) to initiate browser preloading during server think time.
- Infrastructure Engineering: Work with our custom enterprise web development engineers to configure Brotli 11 compression and low-latency origin server environments.
# /etc/nginx/conf.d/fastcgi_cache.conf
fastcgi_cache_path /var/run/nginx-cache levels=1:2 keys_zone=WORDPRESS:100m inactive=60m max_size=512m;
fastcgi_cache_key "$scheme$request_method$host$request_uri";
fastcgi_cache_use_stale error timeout invalid_header updating http_500;
fastcgi_ignore_headers Cache-Control Expires Set-Cookie;

server {
    listen 443 ssl http2;
    # Early Hints for HTTP 103 asset preloading
    add_header Link "<https://yourdomain.com/wp-content/themes/custom/assets/critical.css>; rel=preload; as=style" always;

    location ~ \.php$ {
        fastcgi_pass unix:/run/php/php8.3-fpm.sock;
        fastcgi_cache WORDPRESS;
        fastcgi_cache_valid 200 301 302 60m;
        fastcgi_cache_bypass $skip_cache;
        fastcgi_no_cache $skip_cache;
        add_header X-FastCGI-Cache $upstream_cache_status;
        include fastcgi_params;
    }
}
3. Critical LCP Hero Asset Prioritization Protocol (High Fetchpriority & Preloading)
Largest Contentful Paint is frequently bottlenecked by resource load delay when hero images are buried in external stylesheets or delayed behind client-side rendering scripts.
- Eliminate Hero Lazy-Loading: Remove
loading="lazy"from above-the-fold media assets to prevent the browser layout engine from delaying initial resource requests. - Preload Scanner Hints: Inject
<link rel="preload" fetchpriority="high">tags directly into the server-rendered HTML document<head>to alert the preload scanner before external CSS is downloaded. - Modern Image Compression: Serve responsive AVIF and WebP image variants using the
<picture>element with explicit dimensions to cut payload weight by 60% compared to legacy JPEG formats. - Conversion Impact Evidence: Published findings from the Google Chrome CrUX & Web Vitals Official Telemetry Report reveal that sub-2.5s LCP performance produces a 24% reduction in mobile page abandonment and an 18% lift in checkout conversion rates.
<!-- Preload Scanner Directive in <head> -->
<link rel="preload" fetchpriority="high" as="image" href="/assets/hero-desktop.avif" type="image/avif" media="(min-width: 768px)">
<link rel="preload" fetchpriority="high" as="image" href="/assets/hero-mobile.avif" type="image/avif" media="(max-width: 767px)">

<!-- Responsive LCP Picture Element in <body> -->
<picture>
  <source media="(min-width: 768px)" srcset="/assets/hero-desktop.avif" type="image/avif">
  <source media="(min-width: 768px)" srcset="/assets/hero-desktop.webp" type="image/webp">
  <source media="(max-width: 767px)" srcset="/assets/hero-mobile.avif" type="image/avif">
  <source media="(max-width: 767px)" srcset="/assets/hero-mobile.webp" type="image/webp">
  <img src="/assets/hero-desktop.jpg" alt="Core Web Vitals Optimization Service Dashboard" width="1200" height="675" fetchpriority="high" decoding="sync">
</picture>
4. Critical Path CSS Inlining & Asynchronous Stylesheet Delivery
External stylesheets block the browser parser from building the render tree until all CSS files are downloaded and processed, directly inflating Largest Contentful Paint delays.
- Critical Path Extraction: Extract above-the-fold CSS rules under 14KB (matching the initial TCP slow-start window) and inline them directly into
<head><style>...</style></head>. - Asynchronous CSS Deferral: Load secondary, non-critical stylesheets asynchronously using the non-blocking media swap pattern (
media="print" onload="this.media='all'"). - Render Tree Acceleration: Eliminate external stylesheet roundtrips so the browser compositor begins painting visual content immediately upon receiving the initial HTML stream.
- Legacy Fallback Handling: Enclose standard stylesheet links within
<noscript>wrappers to ensure complete visual styling for user environments where JavaScript execution is restricted.
<head>
  <!-- Inlined Critical Path CSS (< 14KB) -->
  <style>
    :root{--primary:#000;--accent:#c6f51c}body{margin:0;font-family:system-ui,-apple-system,sans-serif;color:#1a1a1a}
    .header-nav{display:flex;justify-content:space-between;padding:16px 24px}
    .hero-container{max-width:1200px;margin:0 auto;padding:40px 20px;min-height:500px}
  </style>

  <!-- Asynchronous Non-Critical Stylesheet Loading -->
  <link rel="preload" href="/css/non-critical.css" as="style" onload="this.onload=null;this.rel='stylesheet'">
  <noscript><link rel="stylesheet" href="/css/non-critical.css"></noscript>
</head>
5. Absolute Zero-Shift CLS Geometry Declaration & Font Display Optional
Cumulative Layout Shift results from unreserved layout space in the DOM tree, causing visible text and interactive elements to jump unexpectedly when images, banners, and fonts resolve.
- Explicit Spatial Reservation: Declare explicit HTML
widthandheightattributes alongside CSSaspect-ratio: 16 / 9on all responsive images, videos, and embedded media. - Dynamic Slot Containment: Enforce fixed CSS
min-heightandcontain: layout-sizeon third-party advertisement wrappers, cookie banners, and dynamic user widgets. - Zero-Shift Typography: Transition web font loading declarations from
font-display: swaptofont-display: optionalto eliminate layout jumps when custom fonts replace system fallbacks. - AI Parsing Stability: As detailed in our google ai overviews optimization technical guide, visual DOM stability prevents AI retrieval scrapers from misinterpreting shifted passage text.
/* Enforce Modern Media Aspect Ratios */
img, video, iframe {
  width: 100%;
  height: auto;
  aspect-ratio: 16 / 9;
  display: block;
}

/* Reserve Fixed Geometry for Dynamic Ad / Banner Containers */
.dynamic-ad-slot, .cookie-consent-wrapper {
  min-height: 250px;
  background-color: #f7fafc;
  contain: layout-size;
}

/* Zero-Shift Font Definition */
@font-face {
  font-family: 'CorporateSans';
  src: url('/fonts/corporate-sans.woff2') format('woff2');
  font-weight: 400 700;
  font-display: optional;
}
6. JavaScript Hydration Pruning, Web Workers & Long-Task Decomposition
Interaction to Next Paint (INP) failures occur when client-side JavaScript execution monopolizes the main browser thread, delaying the processing of user clicks, taps, and keyboard inputs.
- Long Task Identification: Isolate script operations exceeding 50ms in Chrome DevTools to eliminate main-thread bottlenecks and reduce Total Blocking Time (TBT).
- Task Decomposition via scheduler.yield(): Break heavy JavaScript execution loops into asynchronous micro-tasks using
scheduler.yield()orrequestIdleCallback()to allow immediate UI event processing. - Background Worker Delegation: Offload non-critical third-party analytics, tracking pixels, and chatbot libraries to background Web Workers using Partytown.
- Design System Hygiene: Align JavaScript execution with clean corporate branding and design systems to deliver responsive user interactions under 120ms.
// Task Decomposition Pattern using modern scheduler.yield() or requestIdleCallback
async function processLargeDataset(items) {
  for (let i = 0; i < items.length; i++) {
    performUnitOfWork(items[i]);

    // Yield control back to main thread every 50 iterations to process user inputs
    if (i % 50 === 0) {
      if ('scheduler' in window && 'yield' in window.scheduler) {
        await window.scheduler.yield();
      } else {
        await new Promise(resolve => setTimeout(resolve, 0));
      }
    }
  }
}
7. Automated Performance Regression Guardrails & CI/CD Budgets
Sustaining sub-2.0s load performance requires continuous automated enforcement to prevent code deployments, plugin installations, and marketing scripts from degrading page speed over time.
- Automated CI/CD Verification: Integrate Lighthouse CI (
@lhci/cli) into GitHub Actions and GitLab pipelines to scan pull requests across staging environments before production release. - Hard Latency Budgets: Enforce failure assertions on builds exceeding defined performance thresholds: LCP ≤ 2000ms, CLS ≤ 0.02, TBT ≤ 150ms, and script payloads ≤ 150KB gzip.
- Performance Regression Blocking: Automatically block pull request merges that introduce unoptimized assets or increase main-thread blocking time beyond acceptable margins.
- Enterprise Results & Verification: Review our documented client feedback and case studies to see real-world performance gains, and book a comprehensive performance audit consultation with Yantra Media’s technical team.
// .lighthouserc.json
{
  "ci": {
    "collect": {
      "numberOfRuns": 3,
      "url": ["https://staging.yourdomain.com/"]
    },
    "assert": {
      "assertions": {
        "categories:performance": ["error", {"minScore": 0.95}],
        "largest-contentful-paint": ["error", {"maxNumericValue": 2000}],
        "cumulative-layout-shift": ["error", {"maxNumericValue": 0.02}],
        "total-blocking-time": ["error", {"maxNumericValue": 150}],
        "resource-summary:script:size": ["error", {"maxNumericValue": 153600}]
      }
    }
  }
}
Frequently Asked Questions
What is a Core Web Vitals optimization service?
A Core Web Vitals optimization service is an advanced technical engineering audit that diagnoses and fixes code-level speed and responsiveness bottlenecks on a website. It focuses specifically on Google’s three ranking metrics: Largest Contentful Paint (loading performance), Cumulative Layout Shift (visual stability), and Interaction to Next Paint (page responsiveness).
What causes slow Largest Contentful Paint (LCP)?
Slow LCP is primarily caused by four technical factors: slow server response time (TTFB > 200ms), render-blocking CSS and JavaScript files delaying resource discovery, unoptimized and uncompressed hero images, and client-side rendering bottlenecks where browsers must parse large JavaScript files before painting content.
How do I fix Cumulative Layout Shift (CLS) on WordPress?
To eliminate CLS on WordPress, declare explicit width and height attributes on all images and video embeds, reserve container height for advertisements and dynamic widgets with CSS min-height, replace font-display: swap with font-display: optional, and disable plugins that inject late DOM elements above the fold.
What is the difference between lab data and field data in Core Web Vitals?
Lab data is collected in a controlled environment using simulated device profiles, throttled CPU, and consistent network conditions (e.g., standard Lighthouse scans). Field data (CrUX) reflects actual performance metrics recorded from real users browsing your site across varying devices, browsers, and mobile networks over a 28-day rolling window. Google uses field data to evaluate search rankings.
How does Core Web Vitals affect search rankings and conversions?
Core Web Vitals serve as a confirmed ranking signal within Google’s Page Experience algorithm. Pages that fail the Core Web Vitals thresholds face ranking demotions in competitive search queries. Furthermore, Google’s real-user data indicates that sites meeting Core Web Vitals benchmarks experience 24% lower page abandonment and significantly higher checkout conversion rates.
Why should I use font-display optional instead of font-display swap?
While font-display: swap prevents invisible text by immediately showing a system font, it causes noticeable layout shifts when the custom web font finally loads and replaces the fallback font. font-display: optional gives the custom font an extremely short window (approx. 100ms) to load; if it fails, the fallback font is kept for the session, resulting in zero Cumulative Layout Shift.
Accelerate Your Website to Sub-2.0s Performance
Do not allow technical latency and Core Web Vitals failures to erode your organic search traffic. Yantra Media’s technical SEO and full-stack development engineers deliver comprehensive speed audits, custom caching infrastructure, and zero-shift layout architectures tailored to high-growth enterprises.
Ready for Sub-2.0s Speed and Perfect Core Web Vitals?
Partner with India’s leading technical SEO agency to resolve LCP, CLS, and INP bottlenecks permanently.